

Flourish
Turn your data into charts, maps and interactive stories.
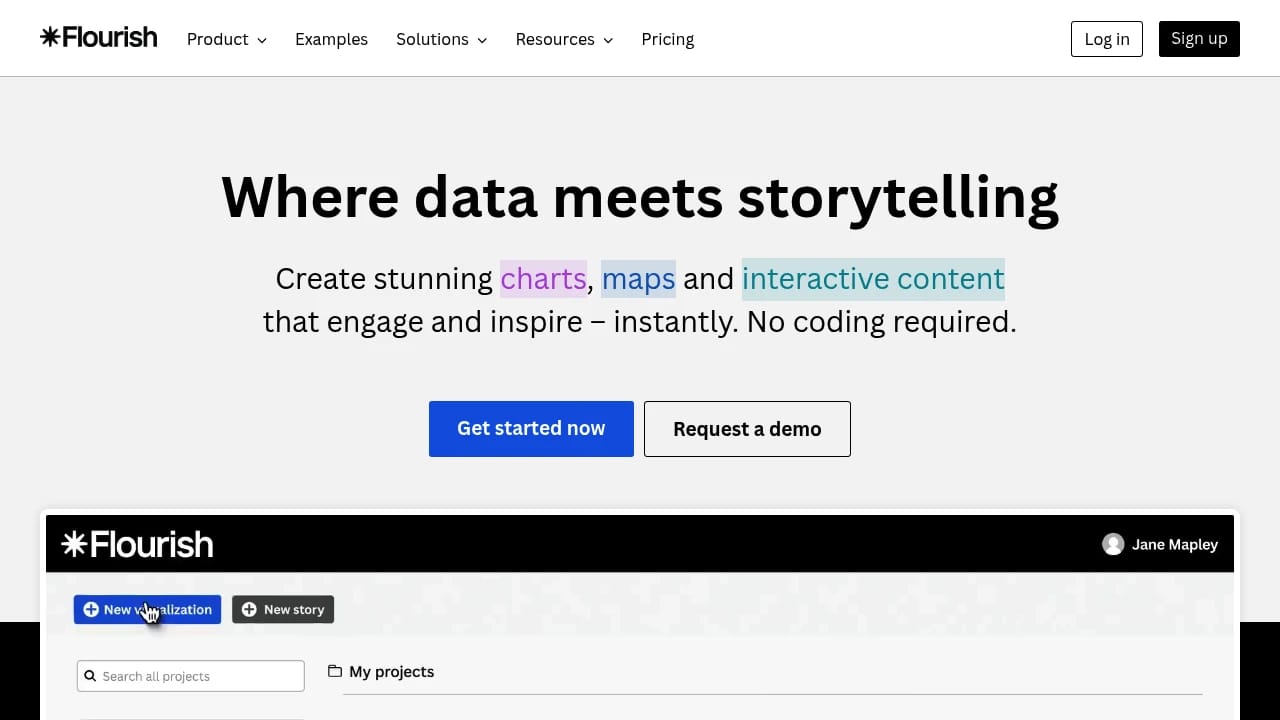
Flourish helps newsletter operators and content creators transform raw data into interactive charts, maps, and visual stories. You can create engaging data visualizations that go beyond static images, making your newsletter content more dynamic and informative.
This tool allows for no-code creation, meaning you can build professional-grade visuals without any programming knowledge. Simply import your data and use the intuitive interface to design compelling graphics quickly.
Interactive content encourages readers to explore data directly, improving engagement and understanding. Your audience can delve into the information, making your data-driven stories more impactful.
Visualizations created with Flourish can be seamlessly embedded across various platforms, including your newsletter's accompanying website or blog. This ensures your data presentations are consistent and on-brand, enhancing your overall content strategy.

Similar to Flourish


